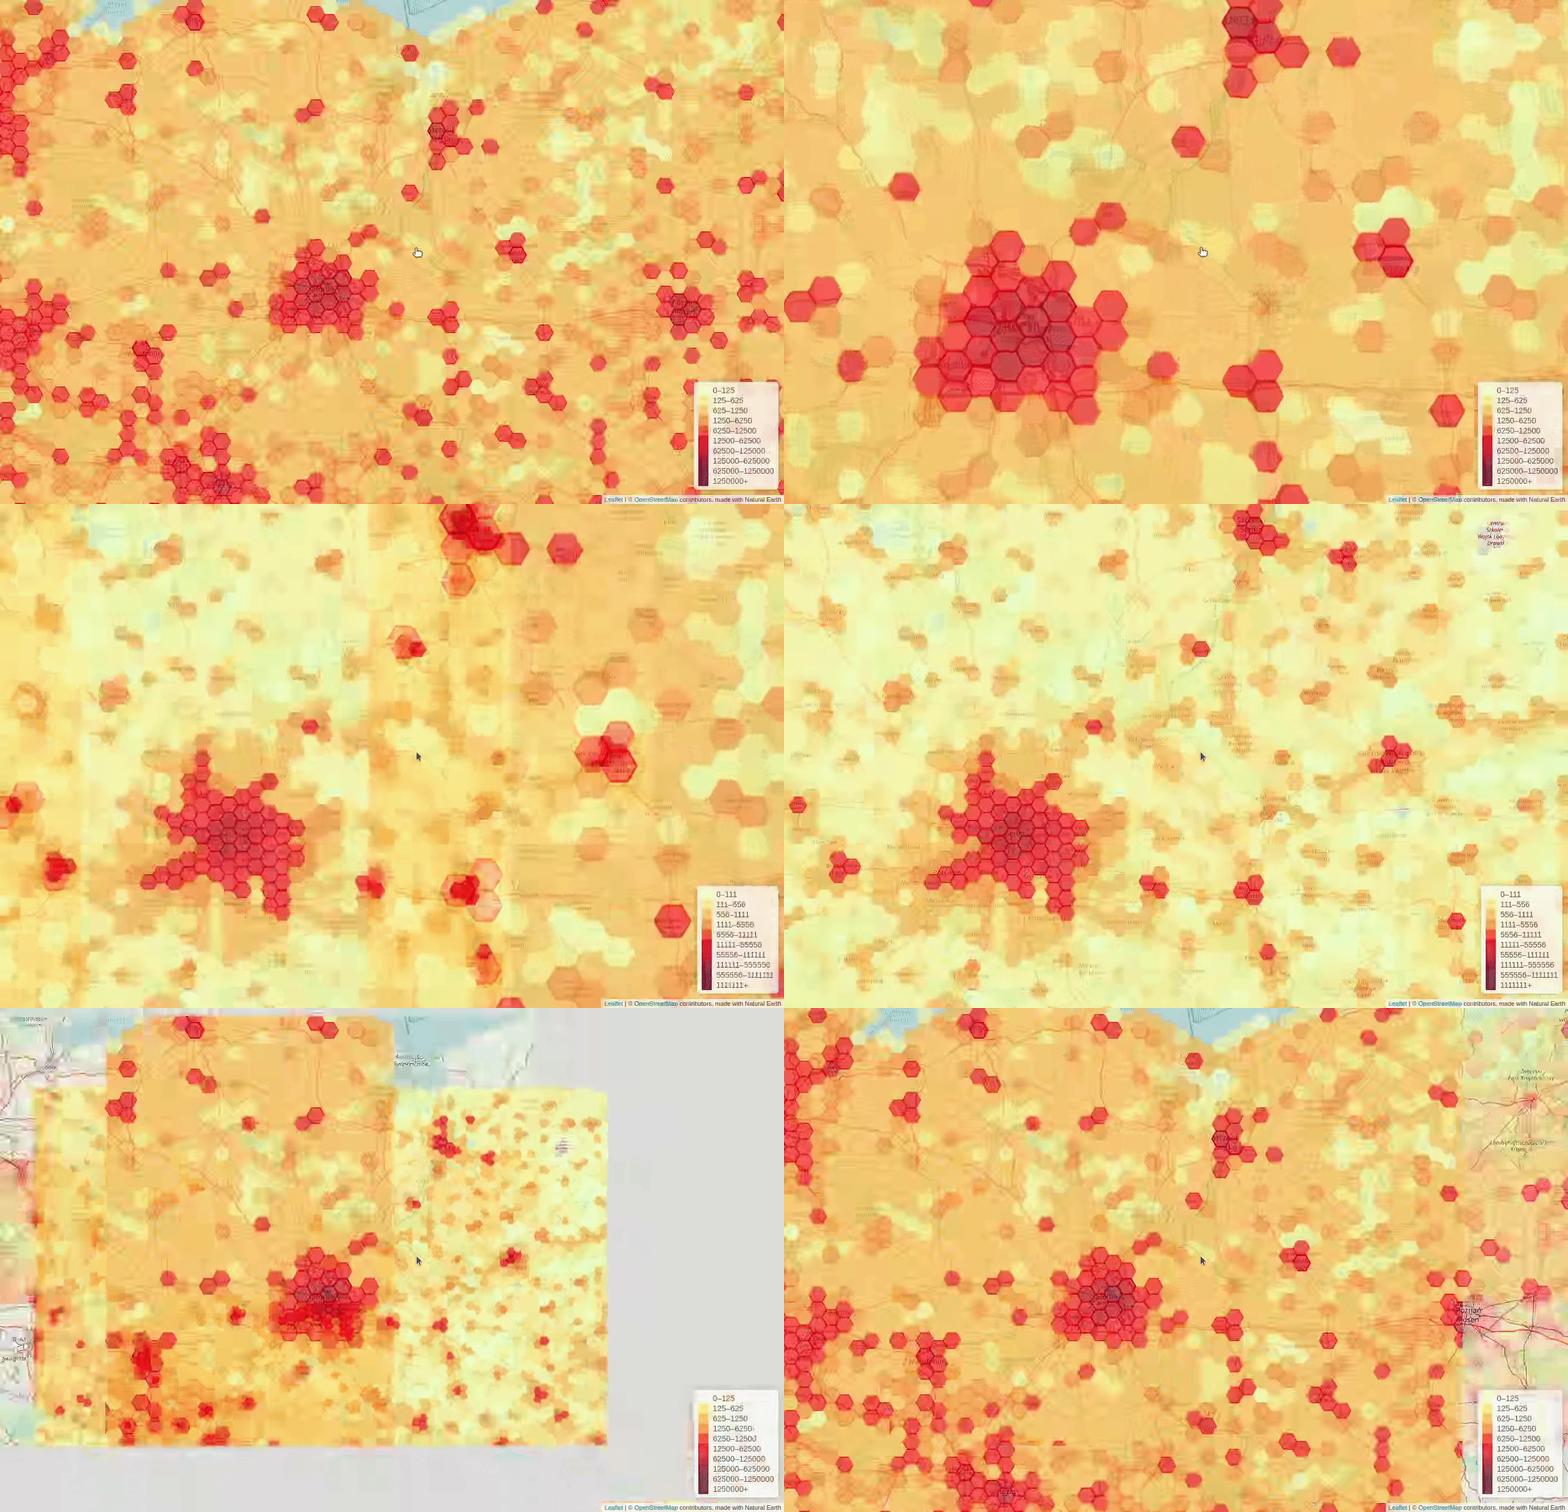
Working on the PurpleAir integration, we realized that the current architecture is limiting performance.
Loading ~10.000 sessions takes several seconds. In fact, AirCasting performs the following:
- BACKEND: Queries multiple MySql tables: users, sessions, streams and sometimes measurements against the filtering criteria
- BACKEND: Loops through records to build the JSON
- Sends tens of megabytes to the browser
- FRONTEND: Loops through each item from the JSON to draw single session markers on the map
- FRONTEND: Clusters single session markers that are close to each other into cluster markers
Currently, the browser needs to know about each individual session matching the filtering criteria to:
a. MAP: Render the single session markers with the average value b. BOTTOM: Render all the session cards c. BOTTOM-LEFT: Export the sessions via email (the URL includes the ids of all the sessions shown on the map to export) d. Probably some other minor reasons
But there is no need to:
- Render tens of thousands of single markers on the map just to have them clustered later
- Render tens of thousands of session cards; nobody would scroll through all of them
It would be more performant to:
- Calculate the clusters on the backend and send aggregated information (e.g., bounding box, average value) to the frontend (instead of sending each individual session); this will probably reduce the items sent to the browser from ~10.000 to ~200.
- Render one card per cluster (not per session)
Some other ideas:
- Migrate to Postgres and Postgis (instead of MySql)
- Implement the heatmap / crowdmap / clusters with
ST_SquareGridorST_HexagonGrid - Go through a transition period where some things are in MySQL some others in Postgis (PurpleAir?)
- Implement the heatmap / crowdmap / clusters with
- Use QGis to visualize things in development
- Treat latitude and longitude as coordinates in the database, not as decimal numbers.
- Restructure the database schema
- Maybe PurpleAir measurements could be one table instead of four (sessions, streams, measurements, users)?
With the current version of Rails (thanks Tomasz for preparing the foundations to make it possible!), we could use two databases to migrate AirCasting to Postgres / Postgis incrementally. Here's some pseudo-code to keep PurpleAir measurements in Postgis:
gem "pg", "~> 1.3"
gem "activerecord-postgis-adapter", "~> 7.1"


class CreatePurpleAirMeasurements < ActiveRecord::Migration[6.1]
  def change
    create_table :purple_air_measurements do |t|
      t.float :value
      t.st_point "point", geography: true # or geometry: true
      t.datetime "time_local"
      t.datetime "time_utc"
      t.string "location"
      t.string "city"
    end
  end
end

class PostgisApplicationRecord < ActiveRecord::Base
  self.abstract_class = true

  connects_to database: { writing: :postgis, reading: :postgis }
end

class PurpleAirMeasurement < PostgisApplicationRecord
end


PurpleAirMeasurement.new(
  # Need to choose the proper factory.
  point: RGeo::Geographic.spherical_factory.point(longitude, latitude),
  # ...
)
-- Cluster the extent of the measurements in purple_air_measurements
-- and return for each:
-- number of sessions
-- bounding box
-- average value
-- This query is copied from the ST_HexagonGrid docs (see list at the bottom).
SELECT COUNT(*), hexes.geom, AVG(value)
FROM
ST_HexagonGrid(
10000,
ST_SetSRID(ST_EstimatedExtent('purple_air_measurements', 'point'), 3857)
) AS hexes
INNER JOIN
purple_air_measurements AS measurement
ON ST_Intersects(measurement.point, hexes.geom)
GROUP BY hexes.geom;Marysia implemented a cool algorithm to display the heatmap on iOS:
- User selects a single session to display
- The route is drawn as a polyline where segments are connecting the coordinates of each subsequent measurement
- The map is subdivided into 120 squares
- Measurements are bucketized into each square
- Empty squares remain transparent
- Squares containing at least one measurement are colored depending on the average value of the contained measurements
Notice that:
- The algorithm works smoothly with ~30.000 measurements
- All the sessions are stored on the device: no need to query or fetch anything
- The algorithm is implemented to display single session (not all of them at once)
- Single squares are not interactive (i.e., they don't do anything if tapped)
- Polygons are redrawn when zooming and dragging the map
Unfortunately, this wouldn't speed up what the webapp does (see the first list in this document) because iOS does not do the same work:
- Not needed because the data is already on the device
- Not needed because the data is already on the device
- Not needed because the data is already on the device
- and 5. are pretty much done in one pass
- PostGIS in Action
- Elevation Profiles and Flightlines with PostGIS
- How to divide world into cells (grid)
- EPSG 3857 or 4326 for GoogleMaps, OpenStreetMap and Leaflet
- Transform coordinates
- Introduction to PostGIS - Geography
- Introduction to PostGIS - Geometries
- PostGIS Polygon Splitting
- Zalando - Maps with PostgreSQL and PostGIS
- Hex grid algorithm for PostGIS
- PostGIS ST_ClusterDBSCAN vs ST_ClusterKMeans with sample
- Get Bounding Box of Each Polygon (Each Rows in a table) using PostGIS
- Generating a Grid (fishnet) of points or polygons for PostGIS
- Geo-Rails Part 7: Geometry vs. Geography, or, How I Learned To Stop Worrying And Love Projections
- Geographic coordinate system
- How to visualize the density of point data in a grid
- Using geometry or point for postgis
- Polyline Tool
- Objects clustering and grouping with Django, PostGIS and Google Maps
- Map Clustering Algorithm
- Display millions of locations very, very fast
- Split all OSM roads within boundingbox in 20m segments and save to new table
- PostGIS vs. Geocoder in Rails
- Creating a grid within a layer using ST_HexagonGrid with PostGIS
- PostgreSQL Best Practices: Spatial Aggregation Analysis
- Server side clusters of coordinates based on zoom level
- RGeo - Which factory should I use?
- Spatial clustering with PostGIS?
- ST_HexagonGrid
- Waiting for PostGIS 3.1: Grid Generators
